범주형 자료 - 성별
데이터
Textbook_Middle → 025원시_성별.csv 데이터를 다운로드 받아 데이터를 준비한다.
library(tidyverse)

성별_raw <- read_csv("data/025원시_성별.csv")

성별_tbl <- 성별_raw %>%
    set_names("성별")

성별_tbl
# A tibble: 10 × 1
   성별
   <chr>
 1 남
 2 여
 3 남
 4 여
 5 남
 6 남
 7 남
 8 여
 9 여
10 남
표
범주형 데이터라 “남”과 “여” 두 범주를 갖는 범주형 데이터를 요약한다. 범주형 데이터를 요약하는 가장 기본적인 방식은 표를 제작하는 것이다.
성별_tbl %>%
    count(성별, name = "명수") %>%
    mutate(성비 = 명수 / sum(명수) * 100)
# A tibble: 2 × 3
  성별   명수  성비
  <chr> <int> <dbl>
1 남        6    60
2 여        4    40
예쁘게 표로 표현한다.
- TO-DO:
gt팩키지로 예쁘게 표를 만들 필요가 있음.
- TO-DO: 행과 열을 전치하여 표를 제작하는 것도 필요함.
| 성별 | 명수 | 성비 |
|---|---|---|
| 남 | 6 | 60 |
| 여 | 4 | 40 |
- One-More: flextable 패키지를 이용한 심플한 출력
library(flextable)

성별_tbl %>%
    count(성별, name = "명수") %>%
    mutate(성비 = 명수 / sum(명수) * 100) %>%
    flextable()
성별 | 명수 | 성비 |
남 | 6 | 60 |
여 | 4 | 40 |
- One-More: reactable 패키지를 이용한 디테일한 출력
시각화
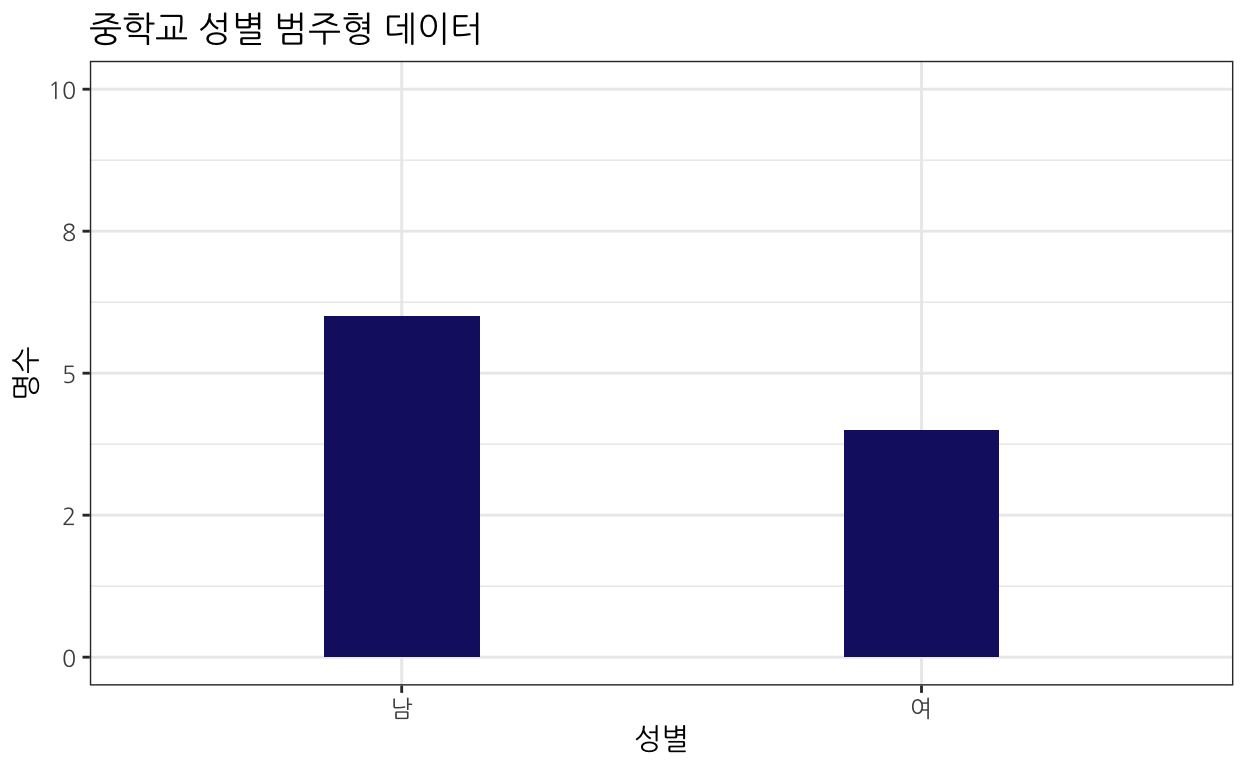
막대그래프
library(gt)

성별_tbl_cnt <- 성별_tbl %>%
    count(성별, name = "명수")

성별_tbl_cnt %>%
    ggplot(aes(x = 성별, y=명수)) +
      geom_col(width = 0.3, fill = "midnightblue") +
      scale_y_continuous(limits = c(0,10), labels = scales::number_format(accuracy = 1)) +
      labs(x = "성별",
           y = "명수",
           title = "중학교 성별 범주형 데이터") +
      theme_bw(base_family = "NanumGothic")
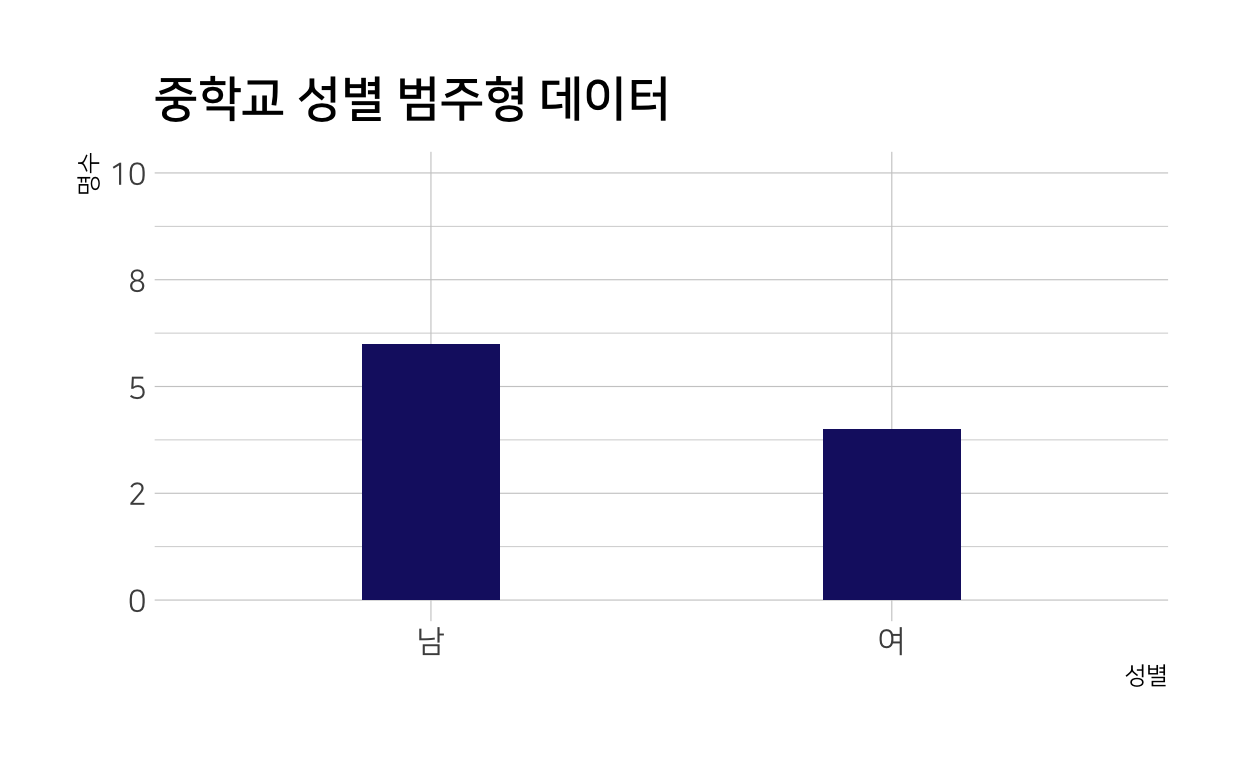
- One-More: hrbrthemes::theme_ipsum 테마의 사용
성별_tbl_cnt %>%
    ggplot(aes(x = 성별, y=명수)) +
      geom_col(width = 0.3, fill = "midnightblue") +
      scale_y_continuous(limits = c(0,10), labels = scales::number_format(accuracy = 1)) +
      labs(x = "성별",
           y = "명수",
           title = "중학교 성별 범주형 데이터") +
      hrbrthemes::theme_ipsum(base_family = "NanumSquare")
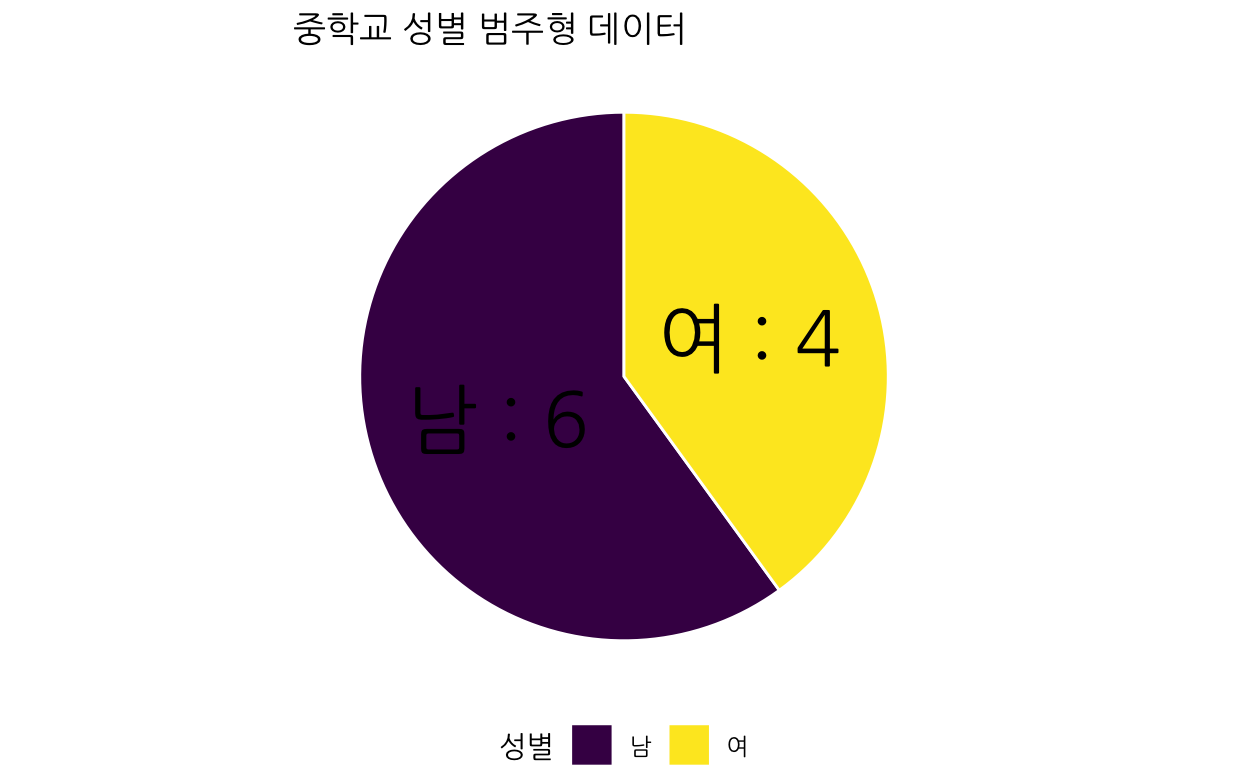
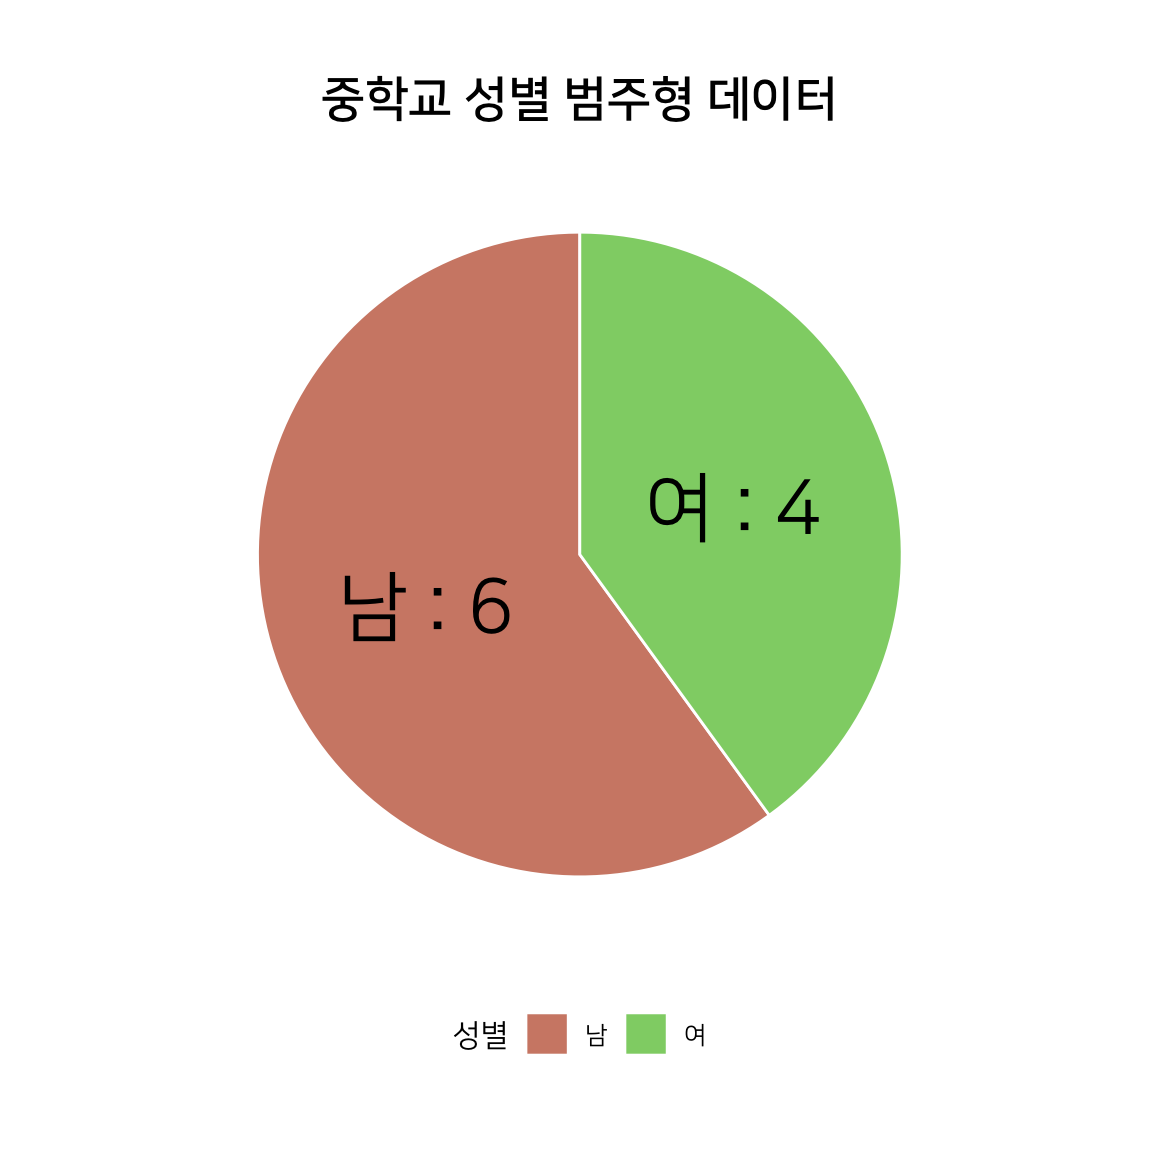
원그래프
성별_tbl_cnt %>%
    ggplot(aes(x = "", y=명수, fill = 성별)) +
      geom_bar(width = 1, stat = "identity", color = "white") +
      coord_polar("y", start = 0) +
      geom_text(aes(label = glue::glue("{성별} : {명수}")),
                position = position_stack(vjust = 0.5),
                family = "NanumGothic",
                size = 10) +
      theme_void(base_family = "NanumGothic") +
      scale_fill_viridis_d() +
      theme(legend.position = "bottom") +
      labs(title = "중학교 성별 범주형 데이터")
- One-More: hrbrthemes::theme_ipsum 테마의 사용
성별_tbl_cnt %>%
    ggplot(aes(x = "", y=명수, fill = 성별)) +
    geom_bar(width = 1, stat = "identity", color = "white") +
    coord_polar("y", start = 0) +
    geom_text(aes(label = glue::glue("{성별} : {명수}")),
              position = position_stack(vjust = 0.5),
              family = "NanumSquare",
              size = 10) +
    hrbrthemes::scale_fill_ipsum() +
    labs(title = "중학교 성별 범주형 데이터") +
    hrbrthemes::theme_ipsum(base_family = "NanumSquare") +
    theme(legend.position = "bottom",
          plot.title = element_text(hjust = 0.5),
          axis.title.x = element_blank(),
          axis.title.y = element_blank(),
          axis.text.x = element_blank(),
          panel.grid.major = element_blank(),
          panel.grid.minor = element_blank())
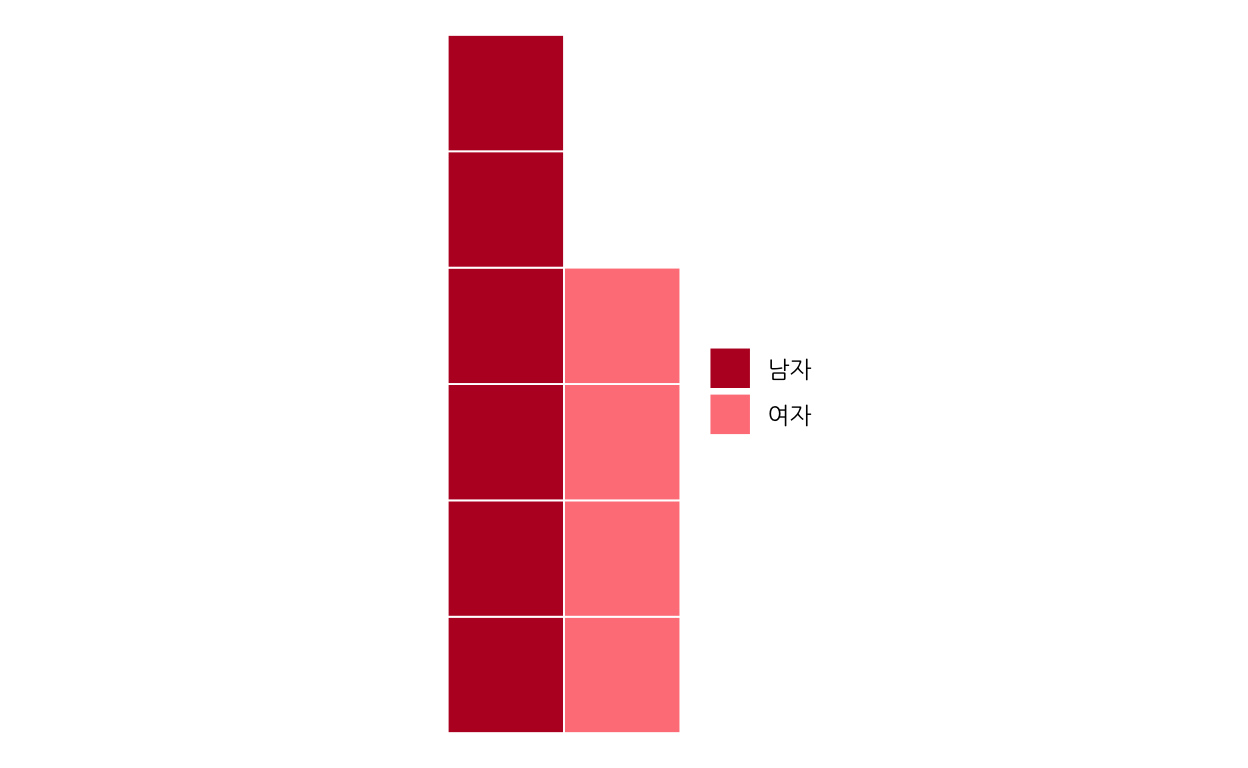
와플 그래프
library(waffle)

성별_tbl_cnt %>%
  ggplot(aes(fill = 성별, values=명수)) +
    geom_waffle(n_rows = 6, size = 0.33, colour = "white") +
    scale_fill_manual(name = NULL,
                    values = c("#BA182A", "#FF8288"),
                    labels = c("남자", "여자")) +
  coord_equal() +
  theme_void(base_family = "NanumGothic")
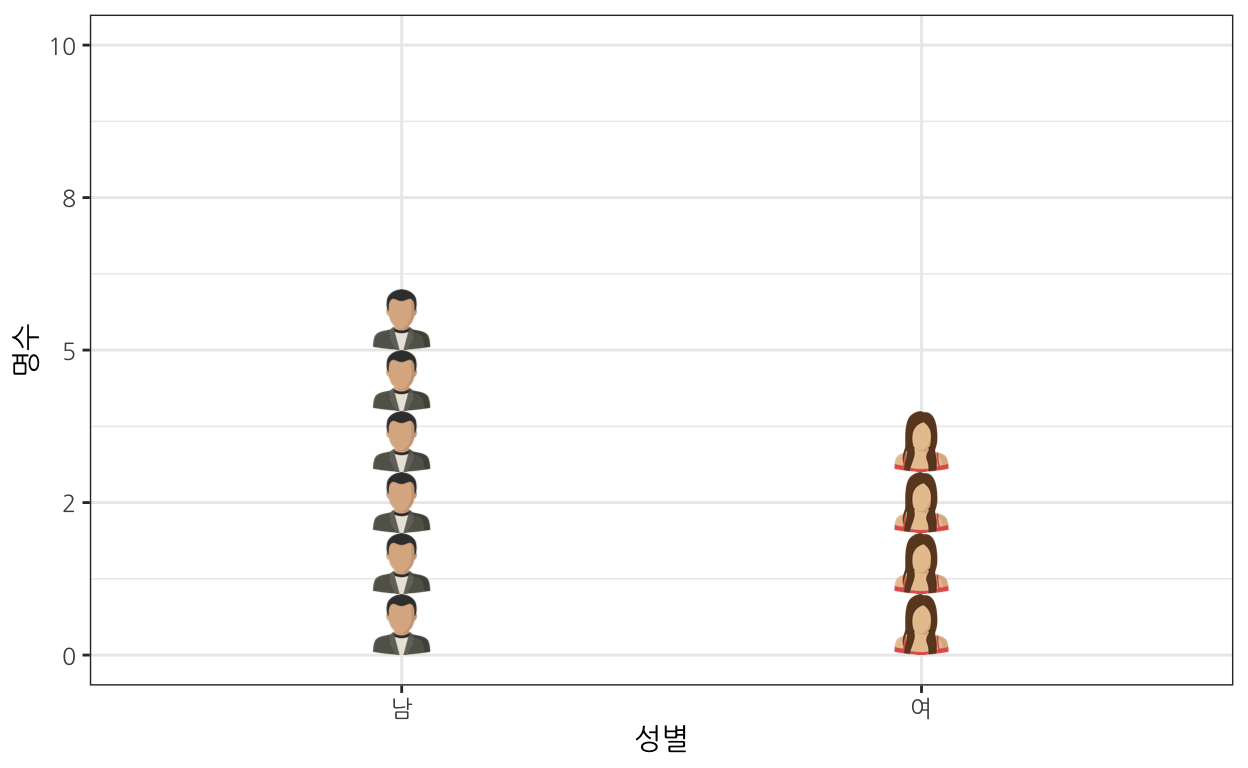
이미지 그래프
library(ggtextures) # devtools::install_github("clauswilke/ggtextures")
library(rsvg)
library(magick)

성별_tbl_cnt %>%
  mutate(image = list(
           # magick::image_read_svg("http://steveharoz.com/research/isotype/icons/man.svg"),
           # magick::image_read_svg("http://steveharoz.com/research/isotype/icons/horse.svg")
           magick::image_read_svg("fig/man-svgrepo-com.svg"),
           magick::image_read_svg("fig/woman-svgrepo-com.svg")
      )) %>%
  ggplot(aes(x = 성별, y=명수, image = image)) +
    geom_isotype_col() +
    scale_fill_manual(name = NULL,
                    values = c("#BA182A", "#FF8288"),
                    labels = c("남자", "여자")) +
    theme_bw(base_family = "NanumGothic")  +
      scale_y_continuous(limits = c(0,10), labels = scales::number_format(accuracy = 1))