연속형 자료 - 수달의 길이
데이터
Textbook_Middle → 031연속_수달의길이.csv 데이터를 다운로드 받아 데이터를 준비한다.
library(tidyverse)

수달_raw <- read_csv("data/031연속_수달의길이.csv")

수달_tbl <- 수달_raw %>%
    set_names("수달길이")

수달_tbl
# A tibble: 30 × 1
   수달길이
      <dbl>
 1     63.2
 2     65.3
 3     67.6
 4     68.7
 5     69.7
 6     60.7
 7     72.4
 8     75.2
 9     64.4
10     76.5
# … with 20 more rows
요약 통계량
수달의 길와 같은 연속형 변수를 요약하는 경우 다음 통계량을 많이 사용한다.
- 중심값: 평균/중위수
- 퍼짐: 분산/표준편차
- 극단값: 최대/최소
library(skimr)
library(gt)

수달_skim <- skim(수달_tbl)

수달_stat <- 수달_skim %>%
    select(contains("numeric")) %>%
    select(-numeric.hist) %>%
    pivot_longer(cols = everything(), names_to = "통계량", values_to = "값") %>%
    mutate(통계량 = str_remove(통계량, "numeric."))

수달_stat %>%
    gt::gt()
| 통계량 | 값 |
|---|---|
| mean | 69.313333 |
| sd | 4.389543 |
| p0 | 60.700000 |
| p25 | 67.300000 |
| p50 | 69.000000 |
| p75 | 72.050000 |
| p100 | 78.100000 |
예쁘게 표로 표현한다.
- TO-DO:
gt팩키지로 예쁘게 표를 만들 필요가 있음.
- TO-DO: 행과 열을 전치하여 표를 제작하는 것도 필요함.
수달_stat %>%
    gt::gt() %>%
      fmt_number(
        columns = 값,
        decimals = 1
    )
| 통계량 | 값 |
|---|---|
| mean | 69.3 |
| sd | 4.4 |
| p0 | 60.7 |
| p25 | 67.3 |
| p50 | 69.0 |
| p75 | 72.0 |
| p100 | 78.1 |
- One-More: dlookr 패키지와 reactable 패키지의 사용
library("dlookr")
library("reactable")
describe(수달_tbl) %>%
    select(n, mean, sd, p00, p25, p50, p75, p100) %>%
    pivot_longer(cols = everything(), names_to = "통계량", values_to = "값") %>%
    reactable(
        fullWidth = FALSE,
        columns = list(
            값 = colDef(format = colFormat(digits = 1))
        )
    )
시각화
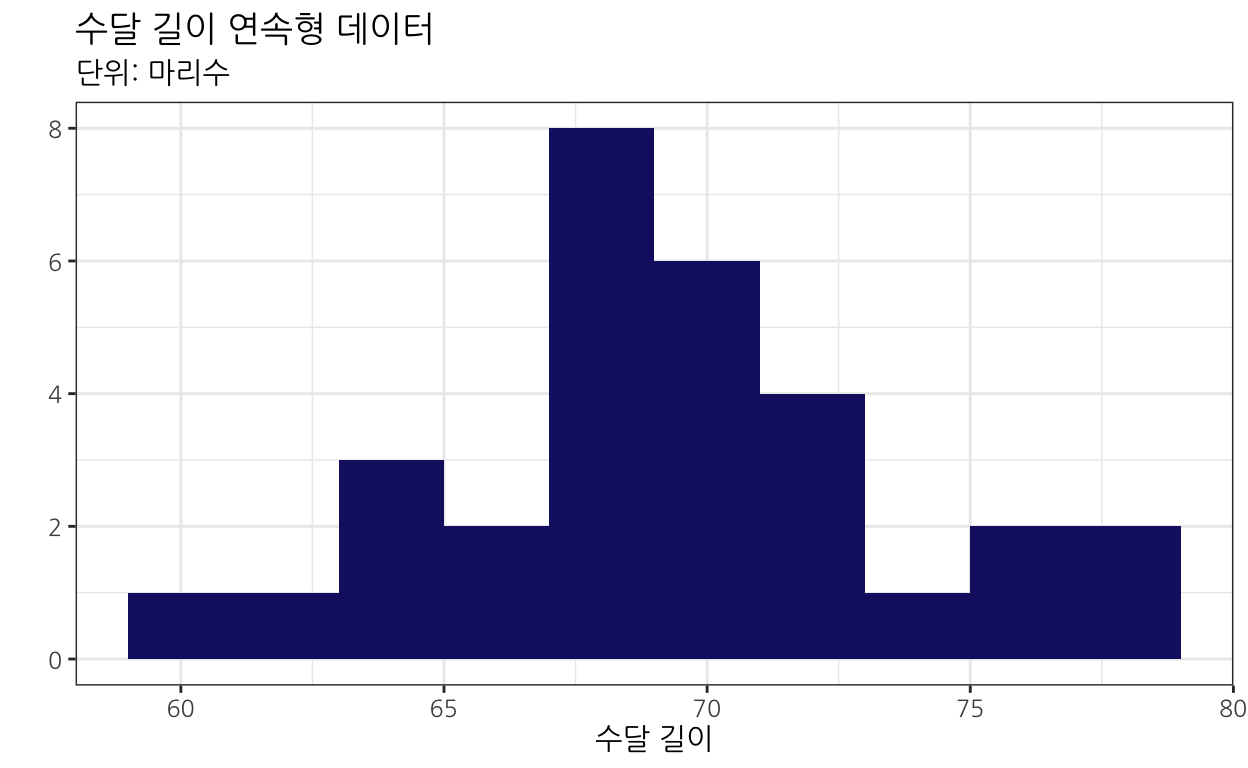
히스토그램
수달_tbl %>%
    ggplot(aes(x = 수달길이)) +
      geom_histogram(fill = "midnightblue", binwidth = 2) +
      labs(x = "수달 길이",
           title = "수달 길이 연속형 데이터",
           subtitle = "단위: 마리수",
           y = "") +
      theme_bw(base_family = "NanumGothic")
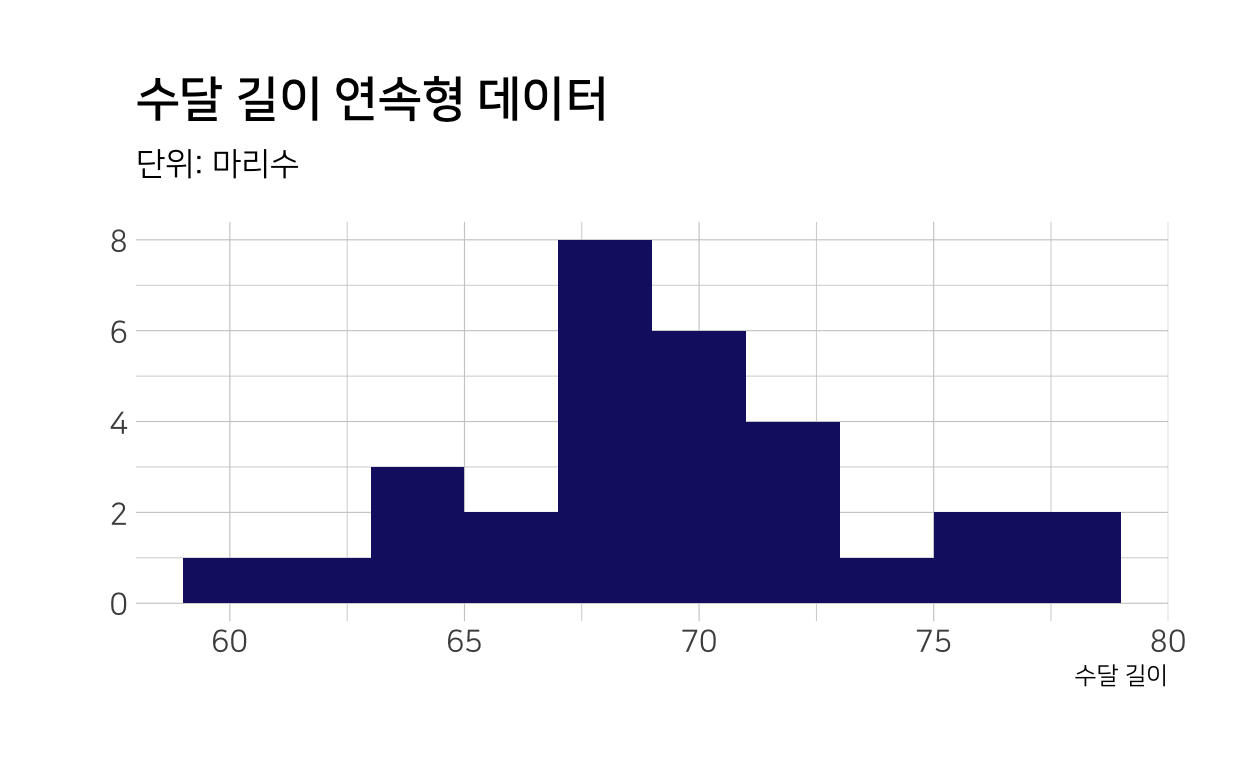
- One-More: hrbrthemes::theme_ipsum 테마의 사용
수달_tbl %>%
    ggplot(aes(x = 수달길이)) +
      geom_histogram(fill = "midnightblue", binwidth = 2) +
      labs(x = "수달 길이",
           title = "수달 길이 연속형 데이터",
           subtitle = "단위: 마리수",
           y = "") +
      hrbrthemes::theme_ipsum(base_family = "NanumSquare")
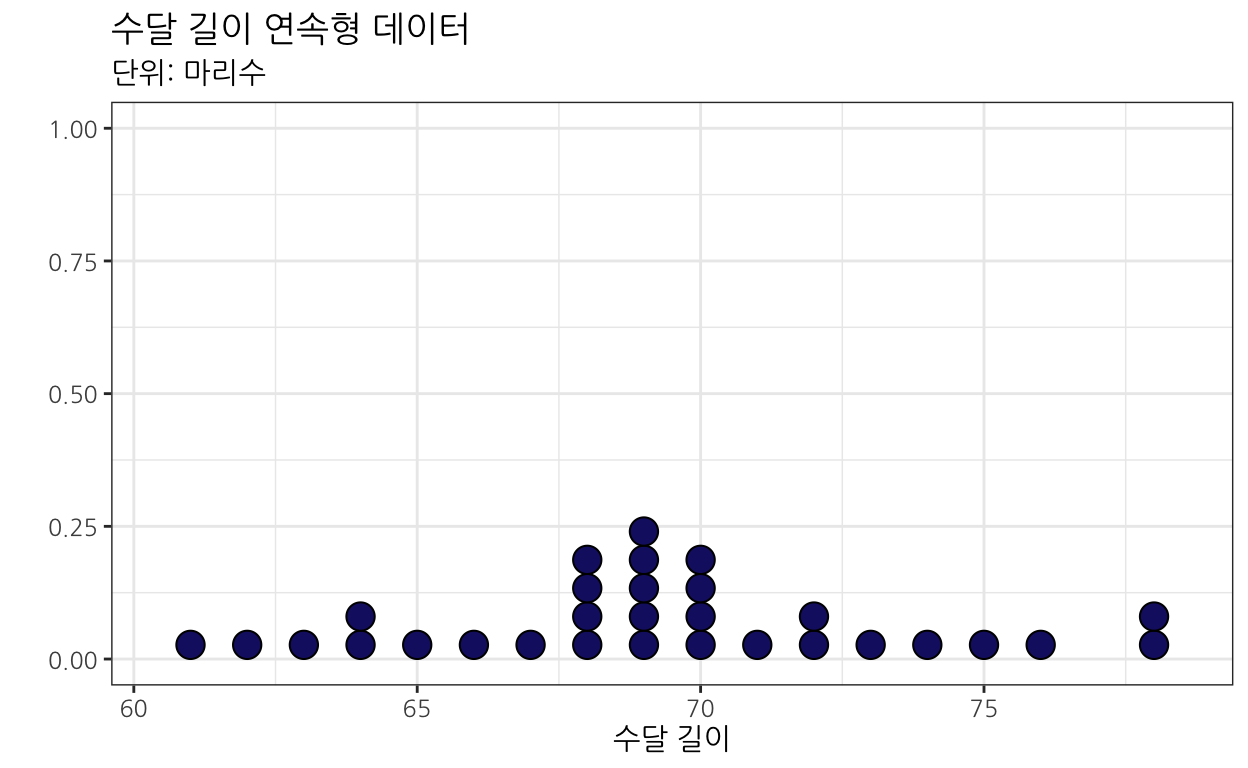
점그래프 - 상대도수
수달_tbl %>%
    ggplot(aes(x = 수달길이)) +
      geom_dotplot(fill = "midnightblue",
                   dotsize = 0.5,
                   binwidth = 1,
                   stackdir = "up",
                    method = "histodot") +
      labs(x = "수달 길이",
           title = "수달 길이 연속형 데이터",
           subtitle = "단위: 마리수",
           y = "") +
      theme_bw(base_family = "NanumGothic")
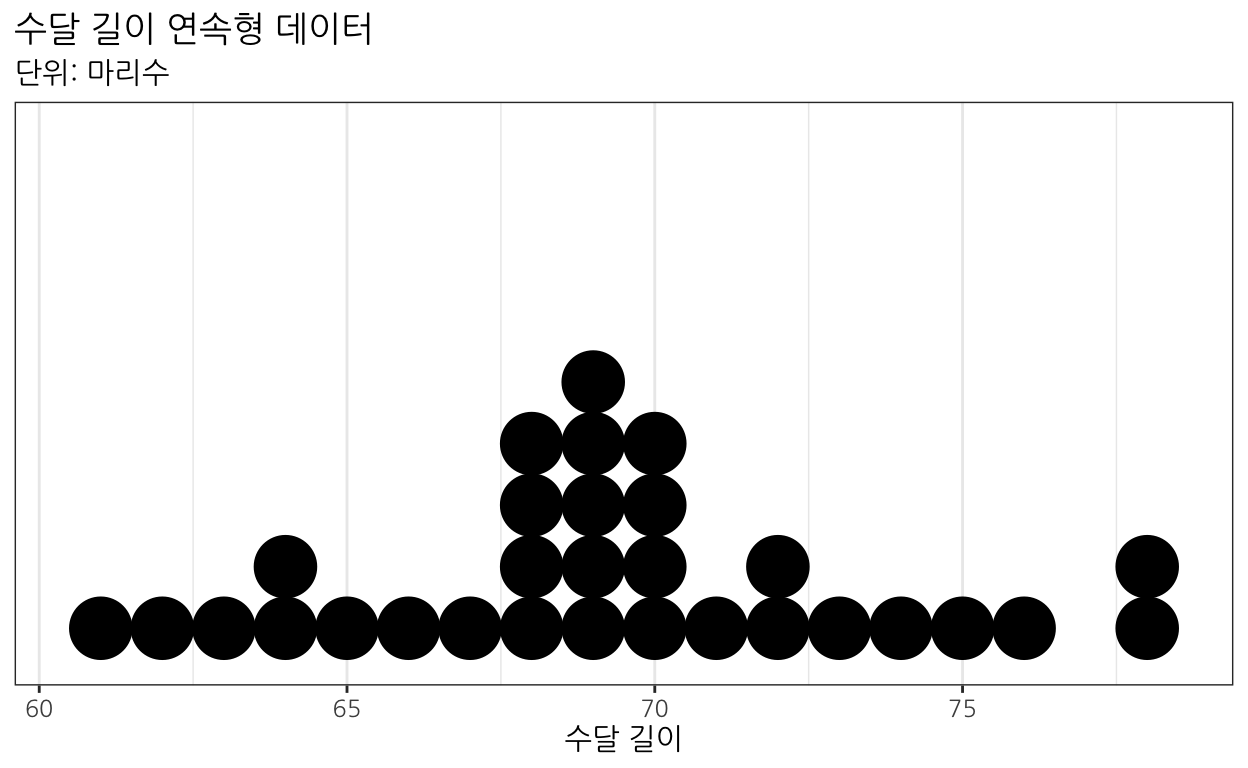
점그래프 - 절대도수
수달_tbl %>%
  ggplot(aes(x = 수달길이)) +
    geom_dotplot(method = 'histodot', binwidth = 1) +
    scale_y_continuous(NULL, breaks = NULL)+
    labs(x = "수달 길이",
         title = "수달 길이 연속형 데이터",
         subtitle = "단위: 마리수",
         y = "") +
    theme_bw(base_family = "NanumGothic")
줄기잎 그림
stem(수달_tbl$수달길이)
  The decimal point is at the |

  60 | 77
  62 | 26
  64 | 43
  66 | 1269
  68 | 236773477
  70 | 253
  72 | 348
  74 | 22
  76 | 56
  78 | 1
tmp <- capture.output(stem(수달_tbl$수달길이))
stem_tbl <- tibble(tmp, rr=1:length(tmp)) %>%
mutate(tmp = str_remove(tmp, "^*.The decimal point is at the \\|"))
stem_tbl %>%
ggplot() +
geom_text(aes(x=rr, y=0, label=tmp), hjust=0) +
coord_flip() +
theme_classic(base_family = "NanumGothic") +
scale_x_discrete(breaks=NULL)+
scale_y_discrete(breaks=NULL, limits=c(0,1))+
theme(axis.text = element_blank(),
axis.title = element_blank(),
axis.ticks=element_blank(),
panel.grid=element_blank(),
axis.line=element_blank()) +
annotate("text", x = 2, y = 0.05, label = "| 기호는 소수점을 나타냄", family = "NanumGothic")
